
EJ Technologies JProfiler 16.3.1 (x64) Download for Windows, Mac & Linux
EJ Technologies JProfiler adalah software profesional untuk menganalisis performa aplikasi Java dan memantau aktivitas Java Virtual Machine (JVM). Tool ini membantu developer menemukan bagian kode yang lambat, penggunaan CPU berlebihan, masalah memori, memory leak, hingga query database yang memengaruhi kecepatan aplikasi.
JProfiler juga menyediakan tampilan analisis yang detail, mulai dari CPU profiling dan memory profiling sampai pemantauan thread, database, serta aktivitas HTTP. Versi terbaru membawa dukungan analisis aplikasi berbasis AI dan integrasi MCP, sehingga developer bisa memeriksa data profiling melalui antarmuka JProfiler maupun AI coding agent yang kompatibel. JProfiler merupakan software komersial dengan opsi evaluasi, bukan freeware tanpa batas.
EJ Technologies JProfiler 16.3.1 Download Links
| Rapidgator | Nitroflare |
|---|---|
| 🟣 DOWNLOAD | 🟡 DOWNLOAD |
Software Information
| Field | Details |
|---|---|
| Title | EJ Technologies JProfiler |
| Latest Release | JProfiler 16.3.1 |
| Release Date | November 13, 2026 |
| Developer | EJ Technologies |
| Publisher | EJ Technologies |
| Category | Java Profiler / Developer Tools |
| License | Commercial (Evaluation Available) |
| Operating System | Windows, macOS, Linux |
| Supported Architectures | x86, x64, ARM, PPC64LE (platform-dependent) |
| Main Technology | Java Virtual Machine (JVM) |
| Official Website | ej-technologies.com |
What Is EJ Technologies JProfiler?
JProfiler adalah Java profiling tool yang digunakan untuk memeriksa bagaimana aplikasi Java menggunakan sumber daya sistem saat berjalan. Developer dapat melihat metode yang paling banyak menggunakan CPU, objek yang memenuhi heap memory, aktivitas thread, serta operasi database dan jaringan yang membutuhkan waktu lama.
Software ini cocok untuk developer Java, software engineer, tim backend, dan administrator aplikasi yang perlu melakukan troubleshooting performa. JProfiler dapat digunakan untuk profiling aplikasi lokal maupun JVM jarak jauh, termasuk lingkungan berbasis Docker dan Kubernetes yang didukung.
Key Features of EJ Technologies JProfiler
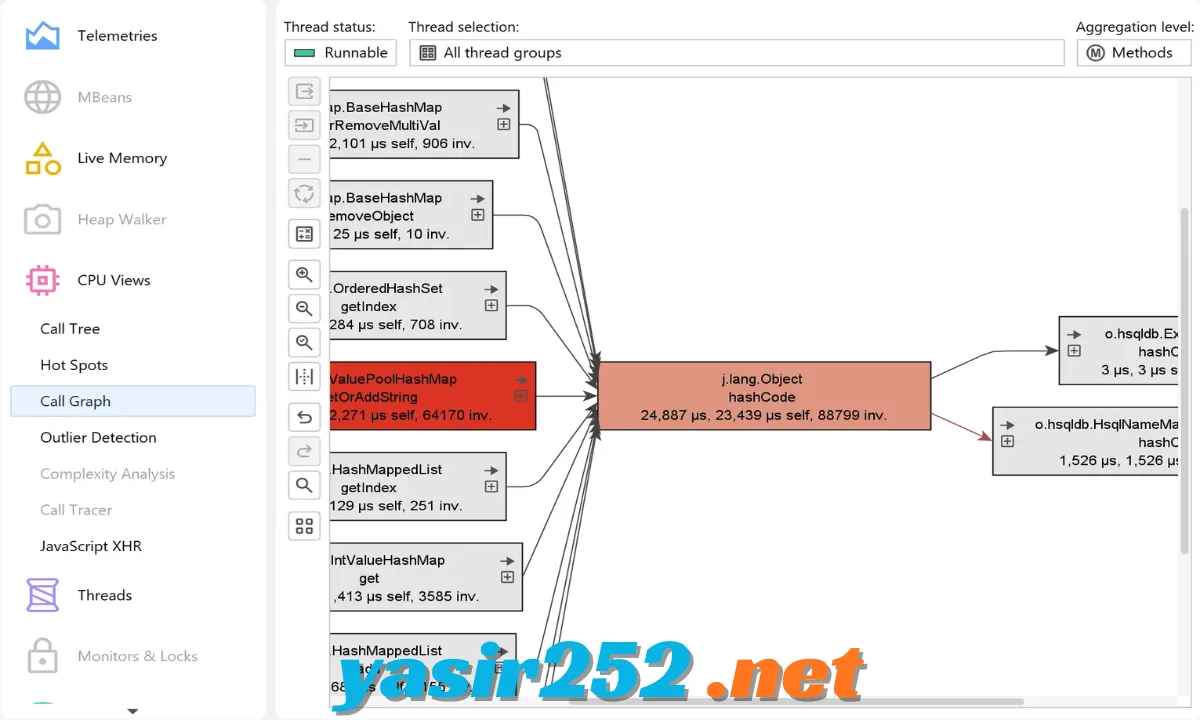
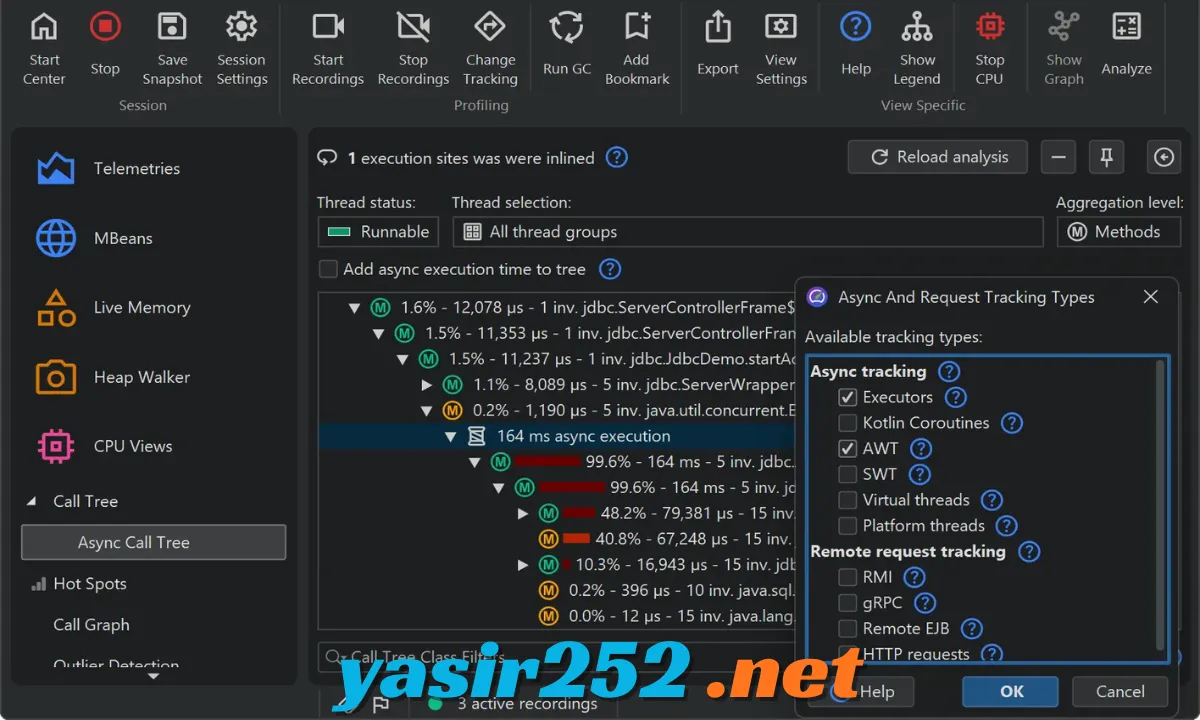
– CPU Profiling: Analisis penggunaan CPU untuk menemukan metode dan bagian kode yang membutuhkan waktu pemrosesan paling besar. Call tree, hot spots, dan flame graphs membantu mempersempit sumber masalah performa.
– Memory Profiling: Pantau alokasi objek, penggunaan heap, dan aktivitas garbage collection. Fitur ini membantu menemukan pola penggunaan memori yang tidak efisien serta potensi memory leak.
– Heap Walker: Periksa objek yang tersimpan di heap dan telusuri hubungan antarobjek. Kamu dapat menganalisis reference chains, jalur menuju GC roots, dominator chains, dan objek berukuran besar.
– Thread Profiling: Pantau aktivitas thread, status thread, dan penggunaan monitor. Fitur ini berguna untuk menyelidiki thread contention, deadlock, serta masalah sinkronisasi.
– Database Profiling: Analisis aktivitas JDBC dan JPA/Hibernate untuk menemukan query database yang lambat atau terlalu sering dijalankan. Data yang ditampilkan membantu developer memahami pengaruh operasi database terhadap performa aplikasi.
– HTTP and Web Profiling: Pantau permintaan HTTP dan aktivitas server yang didukung. Informasi durasi, status, error, serta timeout dapat membantu menemukan masalah pada komunikasi aplikasi.
– AI Application Profiling: AI probe membantu memantau interaksi aplikasi dengan model bahasa besar melalui framework yang didukung, termasuk LangChain4j dan Spring AI.
– MCP Server Integration: JProfiler menyediakan Model Context Protocol server agar AI coding agent dapat mengakses informasi profiling dan membantu menganalisis masalah JVM melalui fitur yang didukung.
– Remote Profiling: Hubungkan JProfiler ke JVM yang berjalan di komputer atau server lain. Dukungan SSH dan remote attach membantu developer melakukan investigasi tanpa harus menjalankan aplikasi secara lokal.
– Docker and Kubernetes Support: Profiling dapat dilakukan pada JVM di lingkungan container yang kompatibel. JProfiler membantu menemukan dan memilih proses yang ingin dianalisis.
– JFR Recording Analysis: Buka dan analisis rekaman Java Flight Recorder untuk memeriksa event JVM serta aktivitas aplikasi dalam periode tertentu.
– IDE Integration: Integrasikan JProfiler dengan lingkungan pengembangan yang didukung agar proses menjalankan dan menganalisis aplikasi Java menjadi lebih praktis.
– Offline Profiling: Atur proses profiling melalui parameter agent atau command-line tools, termasuk konfigurasi perekaman otomatis dan penyimpanan snapshot.
– Performance Snapshots: Simpan hasil profiling untuk dianalisis kemudian atau dibandingkan dengan hasil pengukuran lainnya.
– Cross-Platform Support: Gunakan JProfiler di Windows, macOS, dan Linux dengan paket instalasi yang disediakan untuk masing-masing platform.
What’s New in JProfiler 16.3.1?
The latest changelog entry is JProfiler 16.3.1, released on November 13, 2026. The public download matrix currently lists version 16.3, dated October 26, 2026, so check the official download page for the installer currently offered.
Important improvements in the 16.3 release series include:
-
Improved MCP Server: AI agents can access more profiling information, including heap dumps, thread dumps, garbage collection data, and monitor analysis.
-
Heap Analysis: Analyze large objects, reference chains, GC roots, and dominator chains.
-
AI Probe Updates: Added support for asynchronous and streaming LangChain4j requests, with additional model integrations in 16.3.1.
-
HTTP Server Profiling: Improved recording of asynchronous Servlet and Jetty 12 Handler requests.
-
gRPC Monitoring: Added recording for canceled and expired server calls.
-
JPA and Hibernate: Added support for natural-ID loads.
-
Security Updates: Updated bundled components to address several reported security vulnerabilities.
Supported Platforms and Download Packages
JProfiler provides different installation packages depending on your operating system and architecture.
| Platform | Supported Systems | Download Format |
|---|---|---|
| Windows 64-bit | Windows 10/11, Server 2016–2025 | EXE, ZIP |
| macOS | macOS 11–27, Intel and Apple Silicon | DMG |
| Linux x64 with JRE | Linux x64 | Installer, DEB, RPM, TAR.GZ |
| Linux | x86, x64, PPC64LE, ARMv7, ARMv8 | Installer, DEB, RPM, TAR.GZ |
Approximate Download Sizes
| Package | Size |
|---|---|
| Windows Installer | 185 MB |
| Windows ZIP Archive | 190 MB |
| macOS DMG | 203 MB |
| Linux x64 Installer with JRE | 192 MB |
| Linux Installer | 137 MB |
These sizes correspond to the version 16.3 packages listed on the official download matrix and may change with subsequent releases.
System Requirements
| Component | Requirement |
|---|---|
| Windows | Windows 10/11, supported Windows Server editions |
| macOS | macOS 11–27 |
| Linux | x86, x64, PPC64LE, ARMv7, ARMv8 |
| Processor | Compatible with the selected platform architecture |
| Java Profiling | Supported JVM versions 1.8–27 |
| JProfiler GUI | Java 25 VM |
| Storage | Sufficient space for installation and profiling recordings |
| Memory | Depends on the application being profiled and snapshot size |
The Windows, macOS, and Linux x64 packages include a Java 25 runtime for the JProfiler graphical interface. The command-line attachment tools have a lower Java runtime requirement. Actual profiling compatibility also depends on the JVM and operating system.
Is EJ Technologies JProfiler Free?
JProfiler is commercial software developed by EJ Technologies. Users can download the official installer and obtain a free evaluation licence to test the application before purchasing.
The evaluation version is intended for testing and may include timeouts, usage restrictions, or evaluation warnings. It is not a permanently free full version.
| Feature | Evaluation Version | Licensed Version |
|---|---|---|
| Install JProfiler | Yes | Yes |
| CPU Profiling | Evaluation restrictions may apply | Yes |
| Memory Profiling | Evaluation restrictions may apply | Yes |
| Thread Analysis | Evaluation restrictions may apply | Yes |
| Database Probes | Evaluation restrictions may apply | Yes |
| Remote Profiling | Evaluation restrictions may apply | Yes |
| MCP Integration | Evaluation restrictions may apply | Yes |
| Commercial Use | Subject to evaluation terms | According to licence |
| Full Licensed Access | No | Yes |
JProfiler offers different licensing options, including single-user, single-machine, and floating licences. A purchased single-user licence can be used on multiple computers by the same licensed user.
For a legitimate full version, obtain a licence from EJ Technologies rather than using cracked activation files or modified installers.
How to Download EJ Technologies JProfiler
Follow these steps to download JProfiler directly from its developer:
-
Visit the official JProfiler download page.
-
Select your operating system: Windows, macOS, or Linux.
-
Choose the appropriate installer or archive.
-
Download the package to your computer.
-
Verify the downloaded file using the published SHA-256 checksum if required.
-
Run the installer or extract the archive.
-
Start JProfiler and activate an evaluation or purchased licence.
Official Download: EJ Technologies JProfiler Download
Official Changelog: JProfiler Version History
How to Install JProfiler on Windows
-
Download the Windows 64-bit installer.
-
Locate the downloaded EXE file.
-
Double-click the installer to begin setup.
-
Follow the installation wizard.
-
Choose the installation directory if required.
-
Complete the installation process.
-
Launch JProfiler from the Start menu.
-
Enter your evaluation or purchased licence information when prompted.
How to Profile a Java Application with JProfiler
-
Launch JProfiler on your computer.
-
Create a new profiling session.
-
Select the application or JVM you want to analyze.
-
Configure the profiling settings.
-
Start the application with the JProfiler agent or attach to an existing JVM.
-
Monitor CPU, memory, threads, and supported probe events.
-
Inspect hot spots, call trees, and memory allocations.
-
Save a snapshot for further investigation.
For remote profiling, configure the appropriate profiling agent on the target machine and connect it through the available integration options.
Advantages and Disadvantages
| Advantages | Disadvantages |
|---|---|
| Detailed Java performance analysis | Commercial software |
| Powerful CPU and memory profiling | Evaluation licence has restrictions |
| Advanced heap analysis tools | Can require significant resources for large recordings |
| Supports remote JVM profiling | Requires profiling configuration |
| Database and HTTP monitoring | Some integrations require additional setup |
| AI and MCP integration | Designed primarily for Java development |
| Supports Windows, macOS, and Linux | Full features require a licence |
Frequently Asked Questions (FAQ)
1. What is EJ Technologies JProfiler?
JProfiler is a professional Java profiling application used to analyze CPU usage, memory allocation, thread activity, database operations, and application performance.
2. Is JProfiler available for free?
You can download JProfiler and use a free evaluation licence. Continued full-featured use requires a commercial licence.
3. What is the latest version of JProfiler?
The latest changelog release is JProfiler 16.3.1, dated November 13, 2026. The public download matrix lists version 16.3.
4. Does JProfiler support Windows 11?
Yes. JProfiler supports Windows 11 and Windows 10 on 64-bit systems.
5. Can I use JProfiler on Linux?
Yes. JProfiler provides Linux packages for several architectures, including x86, x64, PPC64LE, ARMv7, and ARMv8.
6. Does JProfiler support macOS?
Yes. It supports Intel-based Macs and Apple Silicon Macs.
7. Can JProfiler find Java memory leaks?
Yes. Its memory profiling and Heap Walker features help developers investigate object references, retained objects, and potential memory leaks.
8. What is CPU profiling in JProfiler?
CPU profiling measures how application code uses processing time. It helps identify slow methods, CPU-intensive operations, and performance bottlenecks.
9. Does JProfiler support Docker and Kubernetes?
Yes. It provides profiling support for compatible JVMs running in Docker and Kubernetes environments.
10. What is the JProfiler MCP server?
The MCP server allows compatible AI coding agents to interact with JProfiler and access profiling information through the Model Context Protocol.
11. Does JProfiler support Spring AI?
Yes. JProfiler includes AI profiling capabilities for supported Spring AI integrations, including additional model support in recent releases.
12. Can JProfiler monitor database queries?
Yes. Its JDBC and JPA/Hibernate probes help analyze database activity and identify slow or inefficient operations.
13. Does JProfiler require Java 25?
The JProfiler 16.3 graphical interface requires a Java 25 runtime, which is bundled with the Windows, macOS, and Linux x64 packages. The profiling agent supports a broader range of JVM versions.
14. Can I profile a remote Java application?
Yes. JProfiler supports remote profiling through its profiling agent and connection tools.
15. Is JProfiler suitable for professional developers?
Yes. It is designed for Java developers and engineering teams who need detailed performance analysis, troubleshooting, and JVM monitoring.
Conclusion
EJ Technologies JProfiler is a powerful Java profiling solution for developers who need deeper insight into application performance. Its CPU profiling, memory analysis, Heap Walker, database probes, remote profiling, and AI integration make it useful for investigating complex JVM applications.
The evaluation version is a good starting point if you want to test its features before purchasing. For unrestricted professional use, download the official installer and activate a valid JProfiler licence.